Chocolate Sales Dashboard - Hello PowerBI/Tableau
This post shares my journey of creating my very first Power BI dashboard by following a helpful YouTube tutorial.
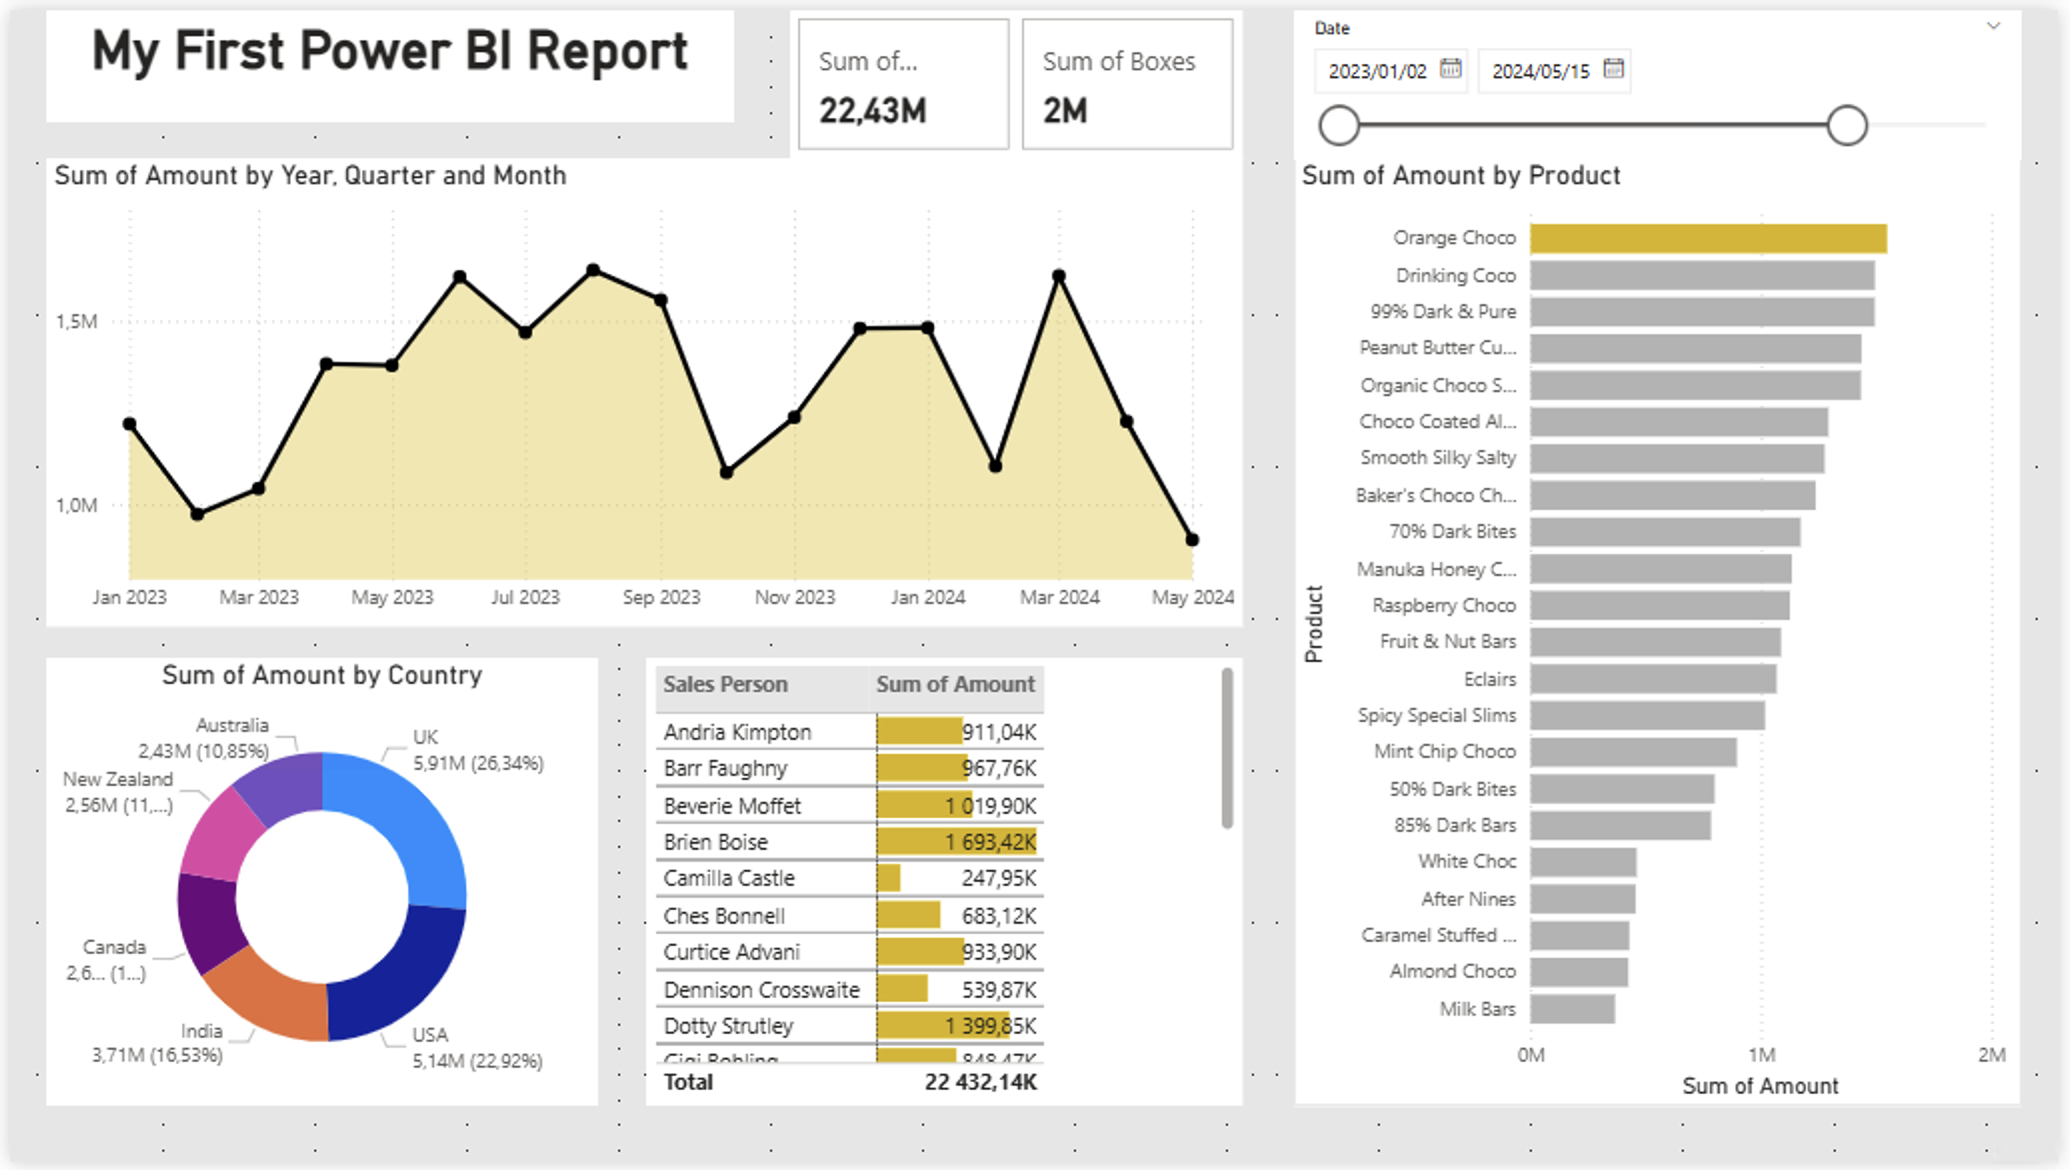
The dashboard shown below is a rough recreation in Tableau Public of the one demonstrated in the video.
🔗 Tutorial Link: Watch on YouTube
📌 What I Learned
1. Introduction to Power BI
- how to get started with Power BI, including downloading and installing Power BI Desktop, loading data, and creating visuals and tables.
2. Creating a Business Report
- step-by-step process of creating a complete business report using Power BI, from loading and preparation of sample data to formatting visuals and sharing the report with others.
3. Power BI Interface
- the main areas of the Power BI interface, including the ribbon, canvas, panels, and switching panel, and how to use these areas to construct and navigate reports.
4. Building Visuals
- how to create various types of visuals, such as column charts, bar charts, and slicers, and how to format and customize these visuals to display data effectively
5. Publishing and Sharing Reports
- the process of saving, publishing, and sharing Power BI reports, including the benefits of using the Power BI online platform for collaboration and data updates.
Final Thoughts 💭
This was my first step into Power BI—a powerful tool for turning raw data into meaningful insights.
To further strengthen my skills and enhance competence across different platforms, I recreated the same dashboard in Tableau Public.
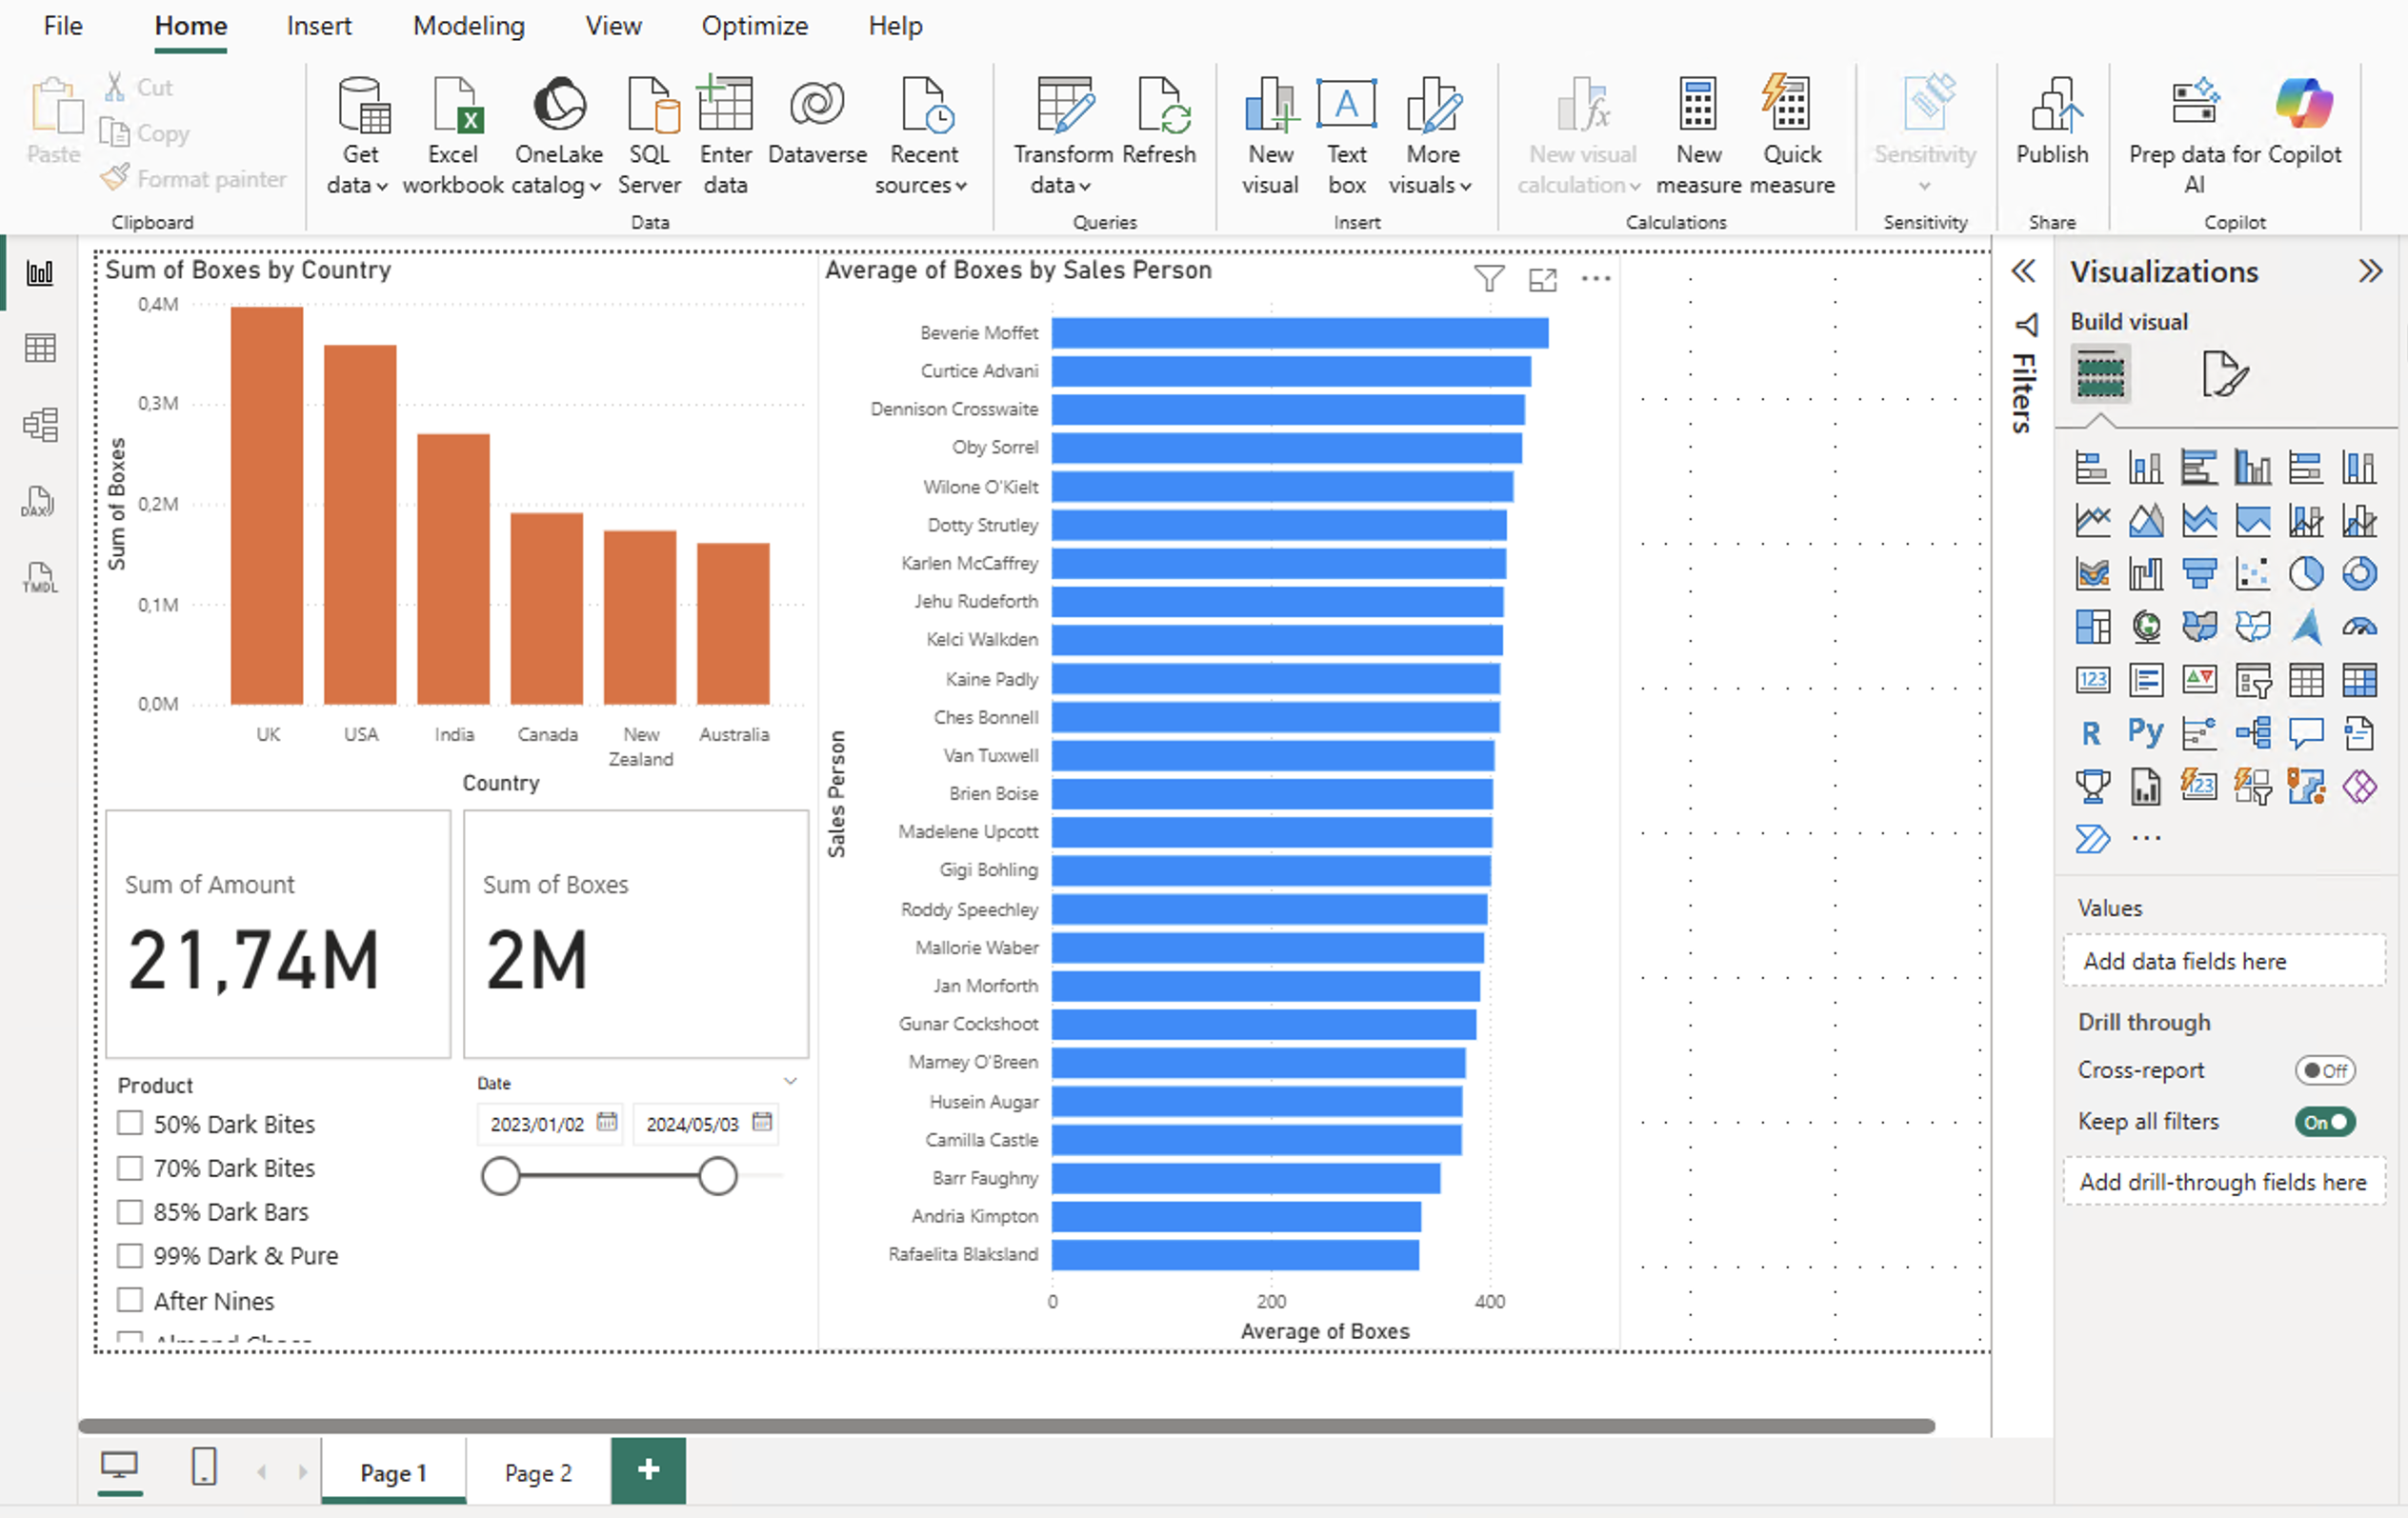
Below is an embedded version of the recreated dashboard for easy access and exploration followed by screenshots from PowerBI:
Screenshots from PowerBI


Enjoy Reading This Article?
Here are some more articles you might like to read next: